
Making good decisions and sticking with them for a long time is a recipe for investment success. Short-term indicators discussed in this email may create an illusion that timing the market is simple. It is not. Anything can happen in markets.
Inflation went north, and stocks traveled south. This has kept many people busy in 2022, and Santa will be no exception. The last half of December is often referred to as the Santa Claus rally, but I believe this year may be different. December is unique because it is the last chance investors can realize capital gains for the year. Of course, most investors avoid taxes, so they would also avoid selling taxable investments in December. Waiting a couple more weeks could delay taxes for another year. This reduction in selling helps create net positive flows for the stock market at the end of the year. This year, there will be fewer capital gains, and December may behave a little more like other months.
What happened last week?
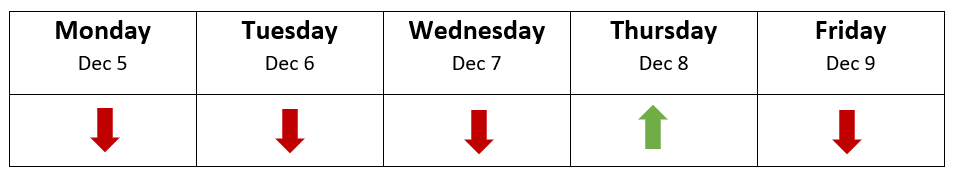
My expectation last week was that the market would turn lower. It did. I am including this daily table again because, for the second week in a row, 4 out of 5 days were down. That is unusual. We have now clearly entered the downward channel that I drew last week. (I have included it again at the end of this commentary.)
Lesson of the Week
The last big recession was in 2008. Going in to that one, interest rates had been very low, and housing prices were high, as well as the supply of homes. Commodities like oil and gold had become very expensive. Another critical ingredient preceding the disaster was investment derivatives that made it too easy to speculate. The whole thing fell in sequence over a few years like dominos. Even the Federal Reserve could not completely stop it once it started.
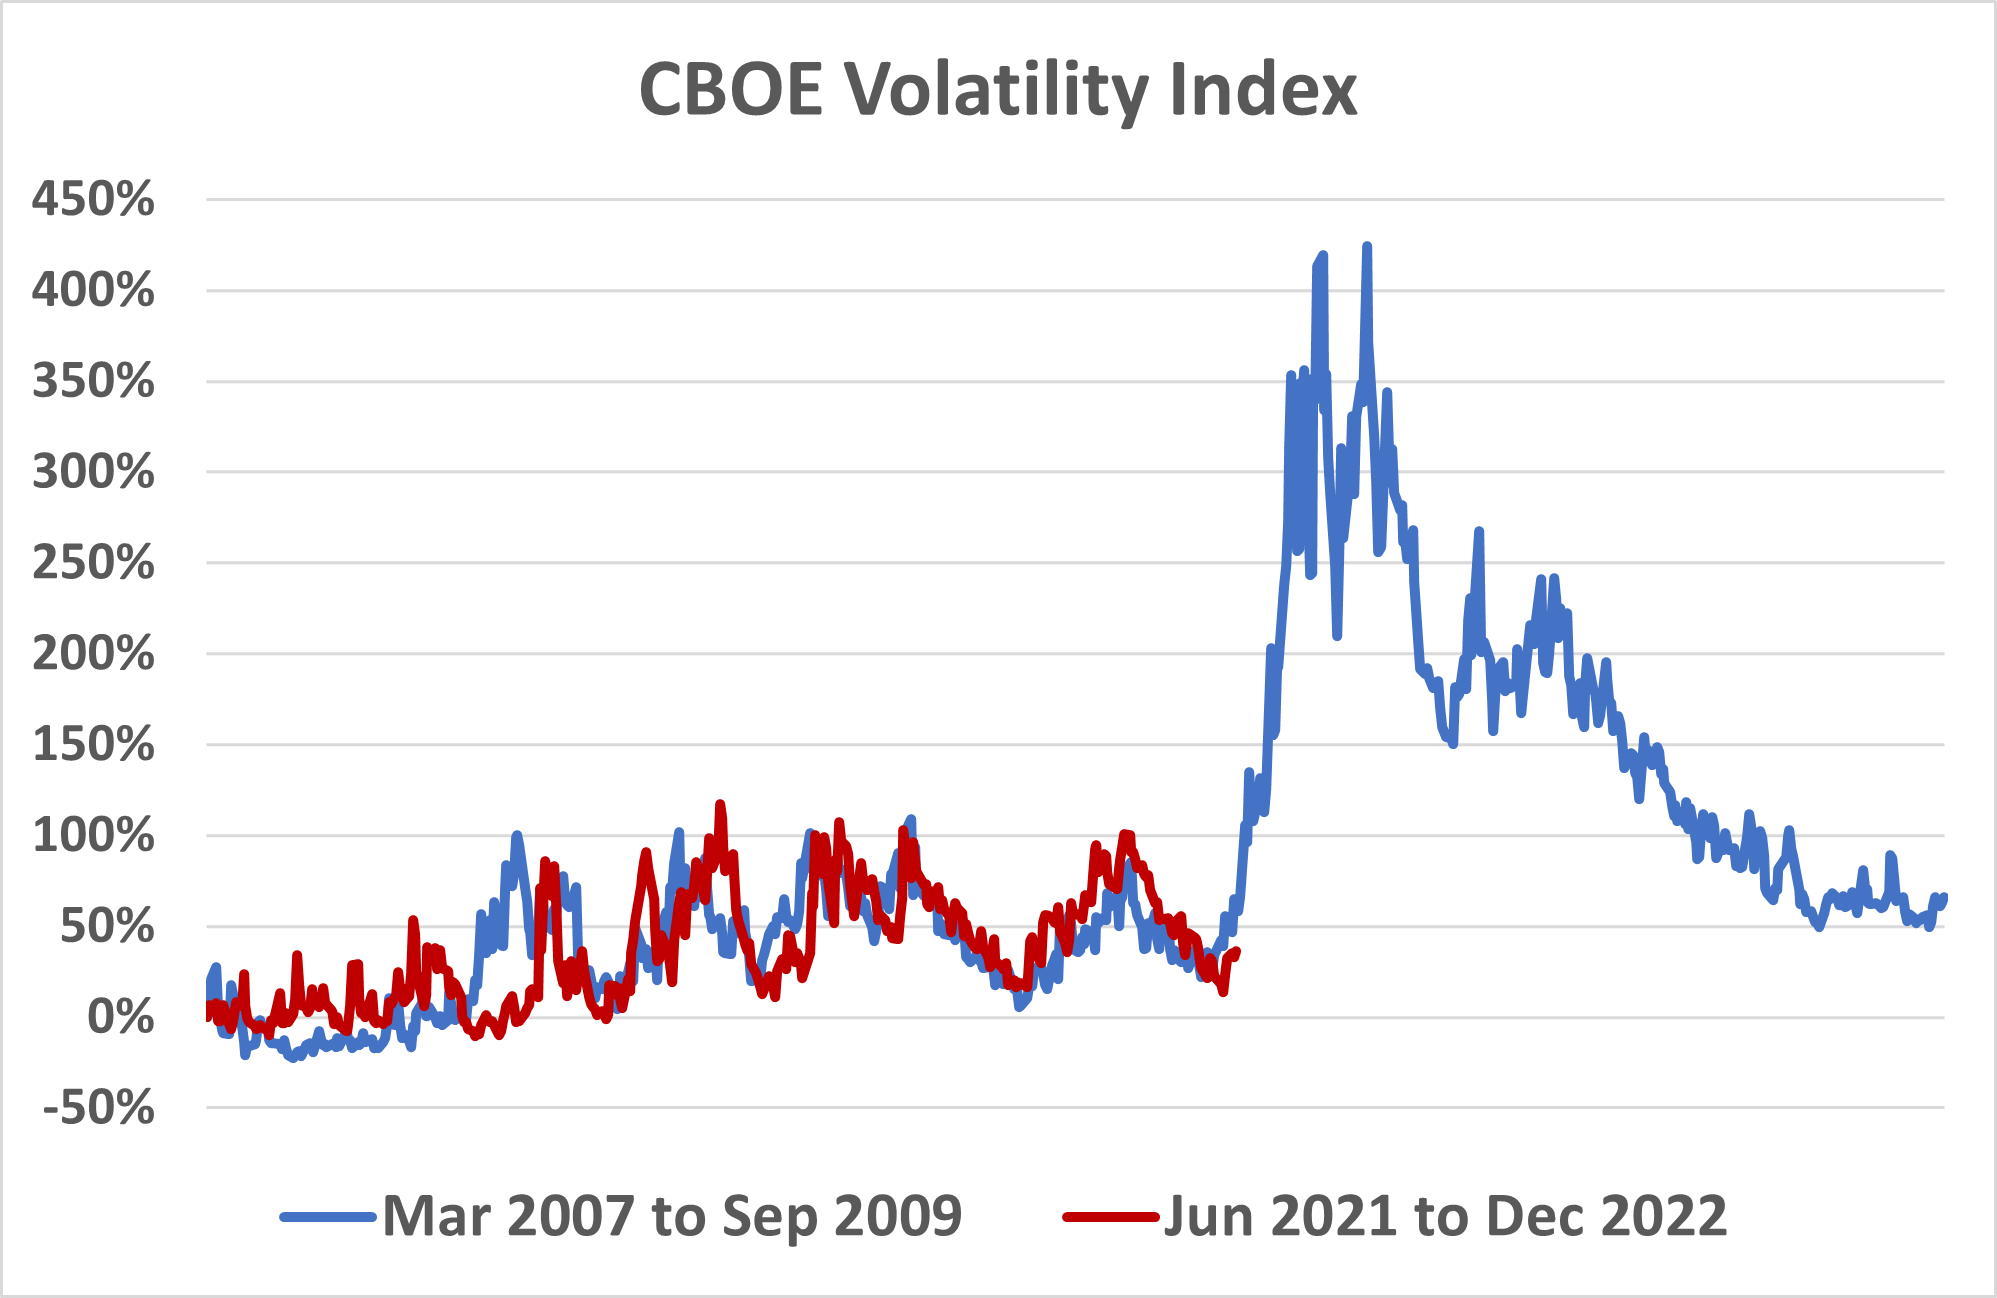
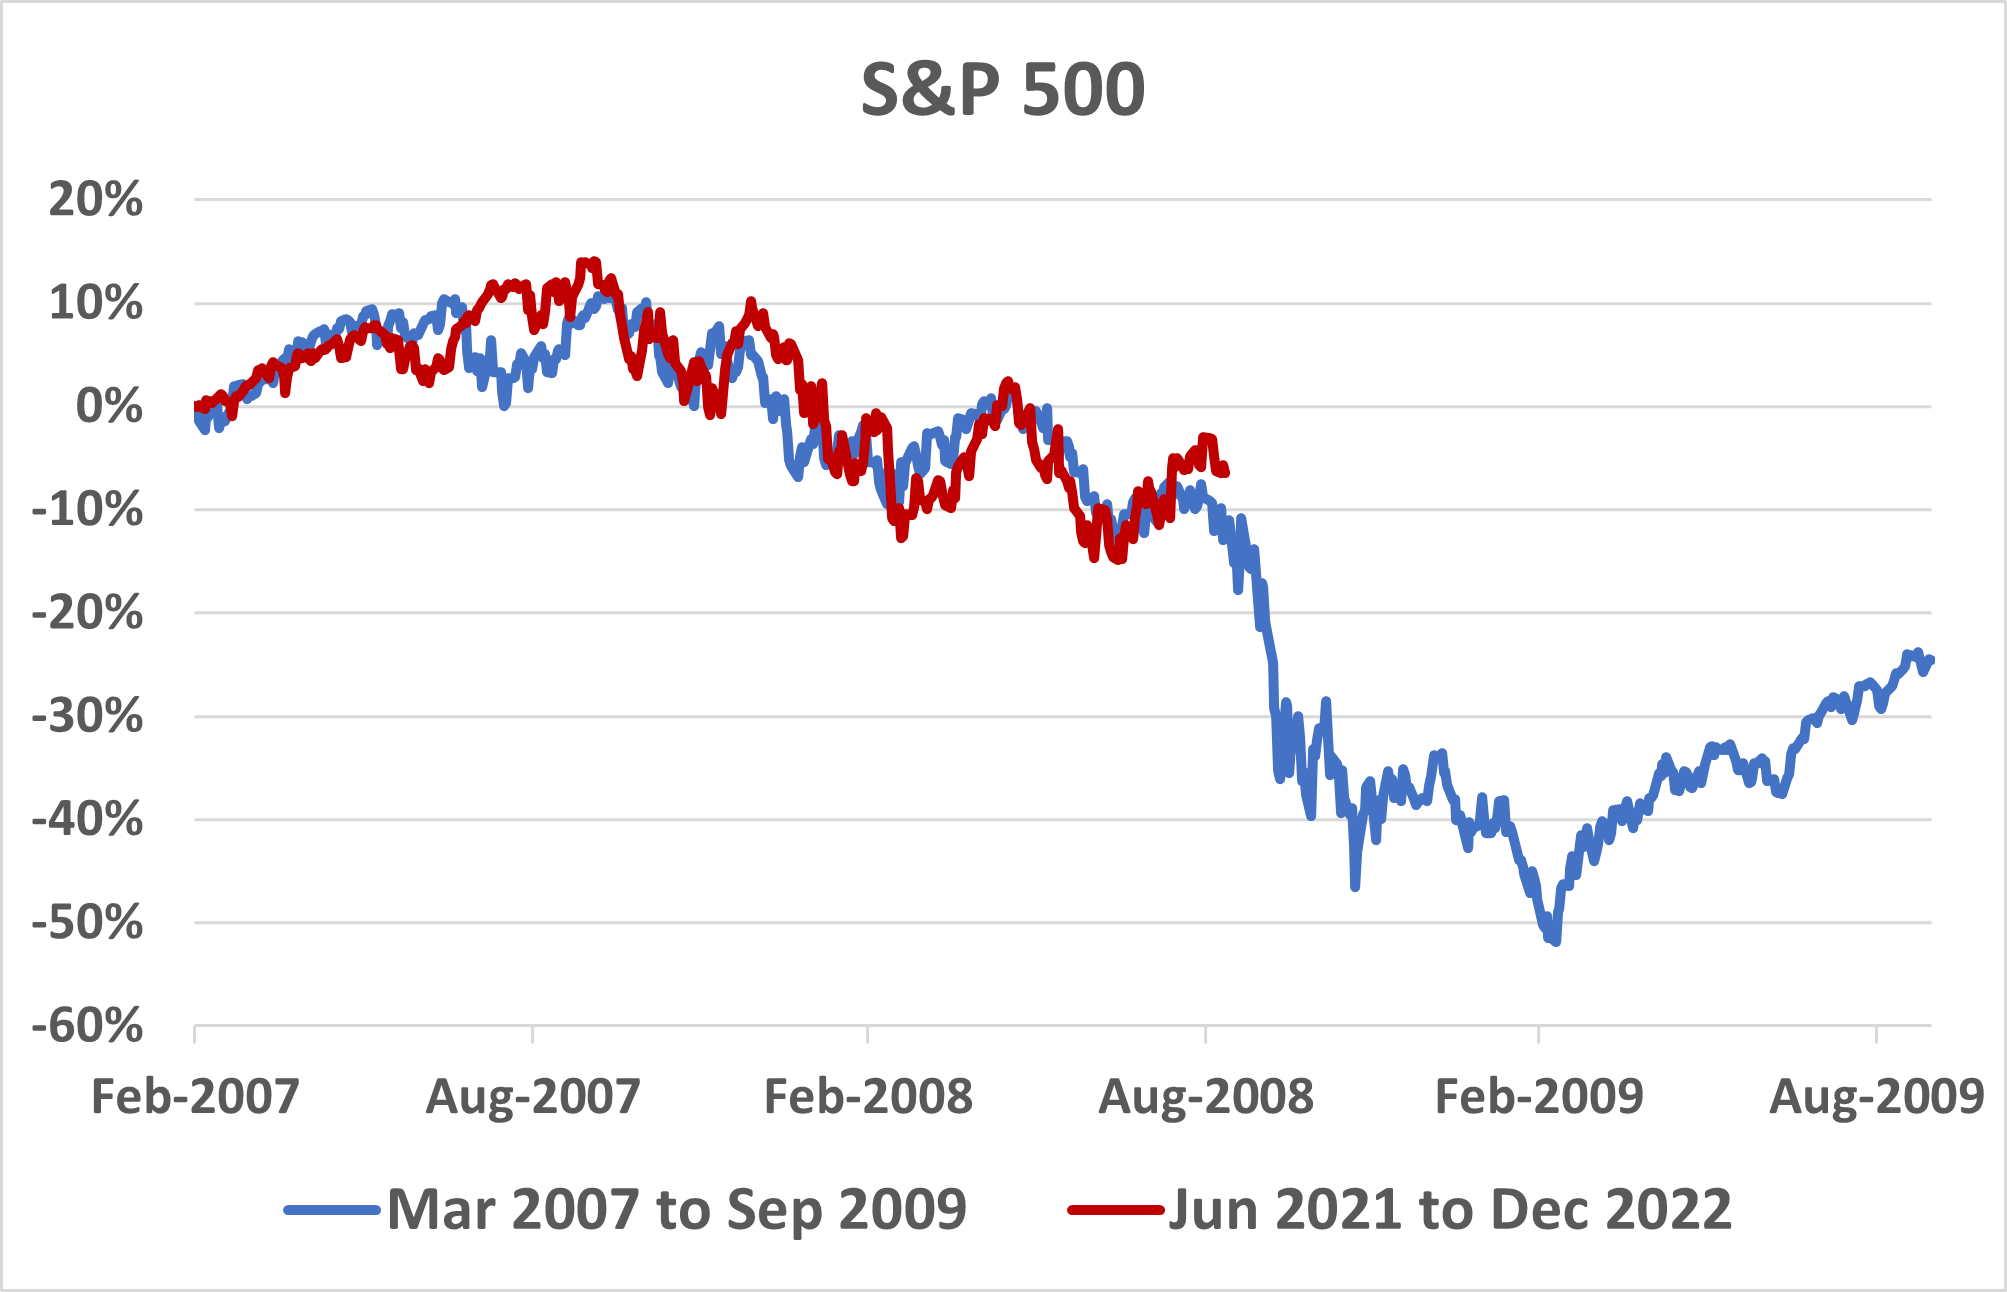
We are living in 2022. This is not 2008. Every market is unique, as are the factors that drive them. The one thing that is similar, even when you go back and read about economic cycles from hundreds of years ago, is human nature. The excitement and fear repeat themselves. Consider the similarity of the charts below. The blue lines are focused on the time around the 2008 recession. The red line is our current situation.
In 2008, we had the implosion of Bear Stearns, the bailout of Merrill Lynch, Fannie Mae, Freddie Mack, etc. In 2022, we had the collapse of a cryptocurrency exchange known as FTX. I do not consider these similar, as FTX was pure speculation from its beginning. However, I have fitted the timelines to see how similar human reactions to uncertainty and risk have been. I was stunned.
CBOE Volatility index is known as the VIX. Sometimes it is referred to as the “Fear Index.” It certainly shows human reaction has been similar. The S&P 500 also shows similar drops and recoveries in duration and scale. If December 2022 were 2008, then, as you can see, we would be in September 2008. This is when Jamie Dimon (from J.P. Morgan) offered a one-dollar bill for all the assets of Lehman Brothers. The offer was not accepted, and no other offers were made. Lehman went down and dragged the entire market with it.
The circumstances have changed, so I do not expect an emergency like in 2008. In my opinion, this will be when the red and blue lines part ways. However, human nature is similar, so the correlation is still possible.
Where are we headed? Inflation and The Fed will determine the path.
Wages have been increasing at around 7% for 127 million Americans that are working full-time. Social Security is about to increase by 8.7% for its 65 million recipients. This is going to keep spending up and keep prices high. Food prices are a growing concern for me personally. How bad is inflation for the economy?
Inflation (CPI) will come out on Tuesday, December 13th. The market has rallied higher 3 of the last 4 times CPI came out as investors celebrated marginal improvements.
On Wednesday, December 14th, the Fed will announce another rate increase. Recently, its members have indicated that the Fed will slow hikes to 0.5%. Investors could react positively or negatively.
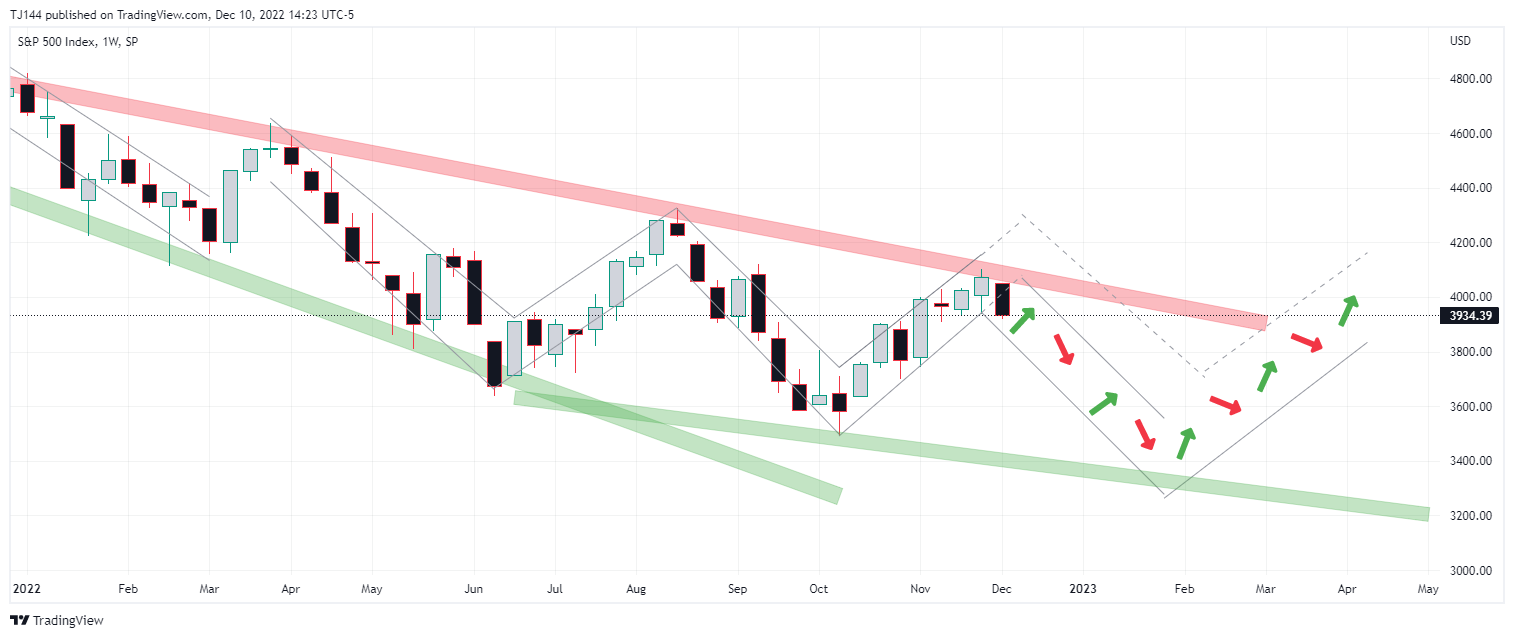
My chart below has changed very little from last week. It is an educated guess of what might happen. The chart uses candlesticks. Each rectangle represents one week of the S&P 500. The black rectangles mean the market closed at the bottom of the rectangle. The grey rectangles mean it closed at the top.
My expectation last week was that the market would turn lower, and it did. We have now clearly entered the downward channel that I drew last week. It would look unnatural for the market to move above the red line at this point. If it was going to do it, it should not have fallen so far last week. It would look unnatural for the market to move back into the upward channel at this point.
A word of caution on charting: The downturn occurring at the red line makes timing the market look easier than it is. The market could have gone down at any point and kept going up beyond the red. In fact, it still could. These lines do not have to hold. I use them more as guidelines. If you look at the October low, it never reached the green line. I have redrawn it to get an idea of what might happen in the future. I suspect the market will be positive enough to go higher than the red line, even if the difficult times are not over. The positive move could happen this week, or it may be next year.
A word of caution on inflation and The Fed: A good inflation report could send stocks up or down. A bad one could do the same. It is also true of The Fed meeting and press conference. Anything could happen. One thing you can count on, I will be watching closely.