

Making good decisions and sticking with them for a long time is a recipe for investment success. Short-term indicators discussed in this email may create an illusion that timing the market is simple. It is not. Anything can happen in the stock market.
Bulls and Bears engaged in an epic battle last week on Wall Street. Bulls pushed Apple stock to an all-time high, with fewer Apple shares being traded than in any week since 1982! Perhaps the lack of conviction is because sales of iPhones and Mac computers may be down 25% from the previous quarter, or the bulls are just getting tired. We will see. Apple is the largest company in America and a good representation of the tug-of-war going on recently—bears versus bulls—both fighting tooth and nail for control.
Economic indicators show a similar phenomenon. The Leading Economic Indicators (LEI) have declined for 14 months in a row. These should predict the future, but things are not that bad right now. This is evident in the Coincident Economic Indicator (CEI), which continues to hit new highs. You can see the change in the graph below.
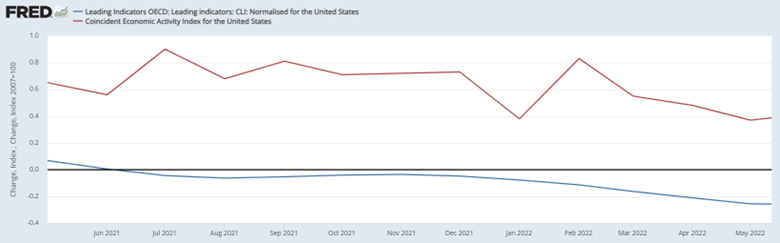
The LEI (blue line) is below zero for nearly the entire two years of this graph. The CEI (red line) is slowing down but has not fallen into negative territory. This disagreement seems strange at first.
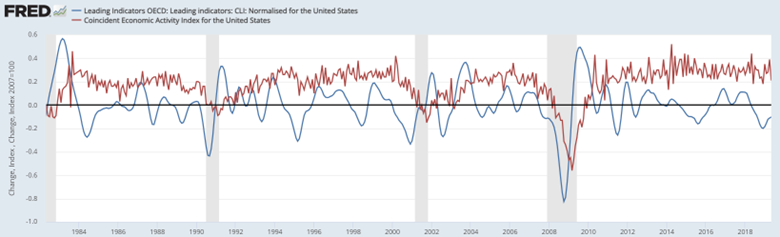
The longer-term chart (below) shows this phenomenon is typical. (Forgive me for excluding 2020 data. It is so extreme that it makes all the lines look flat.) The blue line falls first. Then the red. That is when we find ourselves in a recession (vertical grey-shaded area). It seems obvious based on their names; however, people want to believe this time is different. The good news comes next. Each time we have been in recession, the blue line crosses above the red, and things start to get better in the economy.
Recession is an inconvenient possibility that most economists and investment professionals do not see coming. It is a natural cycle in society and the economy. It will come one day, and it will end. The timing is uncertain.
The LEI (above) is one factor that supports a slowdown of some magnitude. The inverted yield curve, which I have discussed numerous times, is also evidence. (Short-term interest rates continue to be higher than long-term rates.) The final piece of the puzzle is employment.
Employment is incredibly strong. There are not enough workers to meet all the job openings. This could continue for decades if it is just a demographic issue that comes because of all the Boomers retiring. I believe there is also a cyclical explanation. Changes are already evident. Weekly unemployment claims are now averaging over 250,000. This is in the danger zone now. If it continues to rise, overall employment numbers will suffer.
Where Are We Headed?
All the data above is important for making financial decisions. I recommend we all look at our spending to see where we can save a little. We will never regret it. We can always spend the money later. Regarding investment decisions, none of these are reliable indicators for what is to come.
For investment decisions, I look at momentum and extremes that should reverse themselves. A week ago, they were flashing warning signs that were similar to August 2022 and December 2021.
This chart shows the number of S&P 500 companies that are trending above their 20-day moving average. In other words, it graphs the percentage of S&P 500 companies that are trending up. Major changes often occur when it gets too high or too low. I added shaded areas of pink, green, and grey to help interpret what is happening.
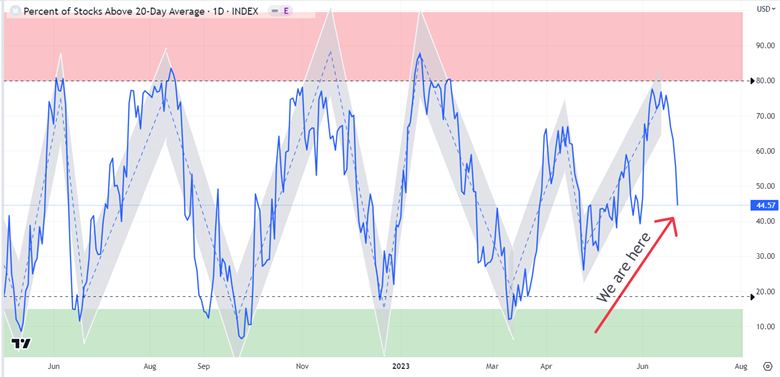
In the first week of June, the blue line touched the pink zone, indicating higher risk going forward. Many of my indicators were already flashing warning signs. This was one of the last. We have already fallen about halfway down. This is surprising, given that we are only one week into the pullback. It reflects the nature of our current stock market. Investors are feeling good about the market, but they are hiding in the largest 7 companies. The other 493 in the S&P 500 are not doing so well. This dislocation will no doubt be an opportunity at some point in the future.
This newsletter is for educational purposes. The opinions may or may not come to pass. Timing the market successfully is extremely difficult. All investing involves risk, including possible loss of principal. The S&P 500 is used here to represent the U.S. stock market. One cannot invest directly in an index. Diversification does not guarantee positive outcomes. This is not a solicitation to buy or sell any security.