

Making good decisions and sticking with them for a long time is a recipe for investment success. Short-term indicators discussed in this email may create an illusion that timing the market is simple. It is not. Anything can happen in the stock market.
Last week, the Fed raised rates again and suggested that it may or may not raise them in the next meeting. It will depend on the data. Some have criticized the Fed for its aggressive campaign in the face of a slowing economy; however, I have not. Chair Jerome Powell and fellow Fed members are doing what needs to be done to bring inflation down, and they may not be done.
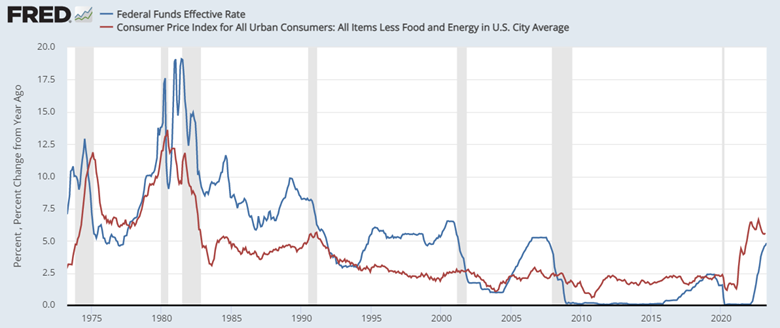
The Fed’s mandate is price stability. Powell describes that as an inflation rate of 2%. One way to get there is to raise interest rates to restrict borrowing in the economy. The model above suggests that means the Fed needs to get its rate (blue line) above the rate of inflation (red line). We are not there yet. (I am using CPI for inflation because it updates on May 10, 2023. The Fed prefers a different measurement, PCE, which would show a similar red line.)
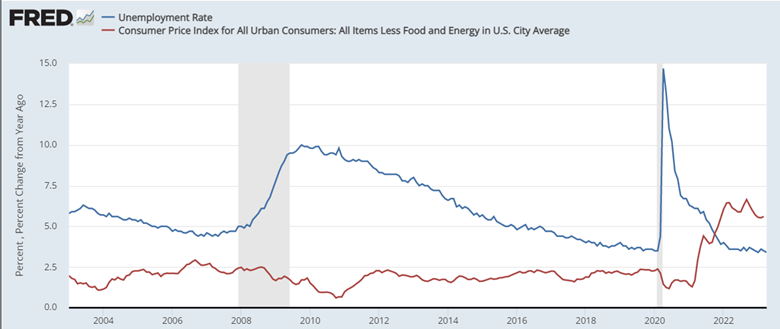
Full employment is the Fed’s second objective. This week we learned that the rate of unemployed is 3.4%, which is incredibly low. The Fed can keep raising rates until the unemployment (blue line) is above inflation (red line). Either the red comes down or the blue goes up.
If we don’t see the red line under one of these blue lines by June 14, 2023 (and if there is no reason to think an abrupt change is about to happen), then I believe the Fed will keep raising rates.
Education Section: Good News Is Good News
Worries on Wall Street have shifted; good news is good for stocks. In 2022, this was not true. The good news was terrible for stocks then. (You can read about it in my December 19, 2022 commentary.) Back then, a strong economy meant the Fed would raise rates more. Nearly every bit of positive news was met by selling stocks and bonds. The concern in 2023 is a recession.
What about bonds? The good news is bad for traditional bonds. Investors here would benefit if interest rates dropped. These have also been a bit out of sync with stocks. Bonds continue to price as if the Fed will lower rates many times this year. Powell continued with his message last week. The Fed has no plans to do so.
After the jobs report, bond investors adjusted their expectations. The Fed really won’t lower rates if unemployment is at an all-time low. Bonds fell on Friday. For the week, stocks and bonds were both down. Full employment is the Fed’s second objective. This week we learned that the rate of unemployed is 3.4%. That is incredibly low. The Fed can keep raising rates until the unemployment (blue line) is above inflation (red line). Either the red comes down or the blue goes up.
Where Are We Headed?
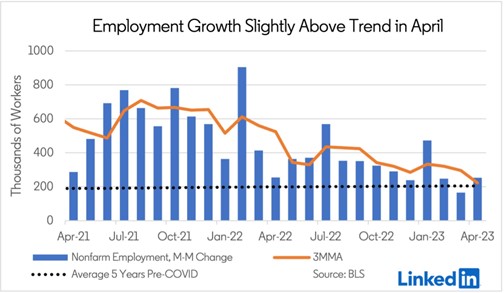
The path forward is murky. Jobs are strong but weakening. The economy is okay but on the verge of recession. Consumers are worried but have plenty of cash to spend. This is a difficult market. One that moves up 2%, then down 3%, then down 2%, then up 3%. In times like this, looking at the big picture is essential. (The orange line is a 3-month average, and its trend is clear.)
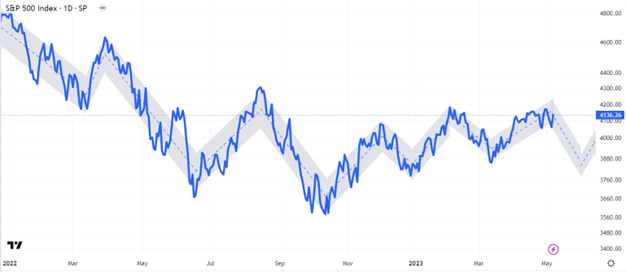
Indecisive is a good word to describe stocks. Asset flows support a rise, but economic and corporate fundamentals do not. The S&P 500 chart reflects this struggle. It has been a long time since it has made meaningful progress in either direction. The possibility of a surprise is very real in May.
This newsletter is for educational purposes. The opinions may or may not come to pass. Timing the market successfully is extremely difficult. All investing involves risk, including possible loss of principal. The S&P 500 is used here to represent the U.S. stock market. One cannot invest directly in an index. Diversification does not guarantee positive outcomes. This is not a solicitation to buy or sell any security.