
I just checked the calendar. It is 2023, and not 2008. What a relief! Last week, I compared our situation to 2008. While there are a lot of similarities, there are also many differences. The action of government officials and the resiliency of the markets has confirmed to me that we will not follow blindly down that old path but will create a new one.
In recent years, U.S. banks took in a record amount of short-term deposits and invested them in longer-term bonds. That mismatch typically means banks have a small but positive profit margin. What we have witnessed in the last year is that interest rates have increased more on short-term than long-term bonds. We call this an inverted yield curve, a classic sign that a recession is coming.
When yields rise, bond prices fall. Banks hide their losses by categorizing them as if the bank will hold them to maturity. This usually turns out fine, but we are dealing with one of the fastest rises in rates ever and one of the worst inverted yield curves ever. When bank customers begin taking their money out in large numbers, banks are forced to sell their investments at whatever price they can get rather than hold them to maturity. Then those hidden losses become real indeed.
Silicon Valley Bank (SVB) was the first to go down. Others have followed. So far, government officials seem determined to avoid a crisis like Lehman Brothers (2008). Rather than just insuring $250 thousand, the FDIC covered 100% of deposits at SVB. The U.S. government also rolled out a new program known as BTFP, which allows banks to borrow money for up to one year. The banks must offer collateral bonds (only certain types accepted), and banks must pay interest. The loans should keep most banks solvent, but the terms are not favorable and should not stimulate growth in the bank or in the U.S. economy.
Education: Yield Curve Indicator
Higher interest rates mean it costs more to borrow. Obviously, this is an economic challenge and one that we face right now. We have another challenge mentioned above: Our yield curve is inverted, and that spells trouble ahead. Many dismiss this indicator. I do not.
When it comes to any loan, you would expect that the interest rate would go up as the duration increases. For example, a 60-month car loan should have a higher rate than a 36-month loan. The same is true of a 15-year versus a 30-year mortgage. Bonds typically follow this rule of thumb as well. When they don’t, we call it an “inverted yield curve.”
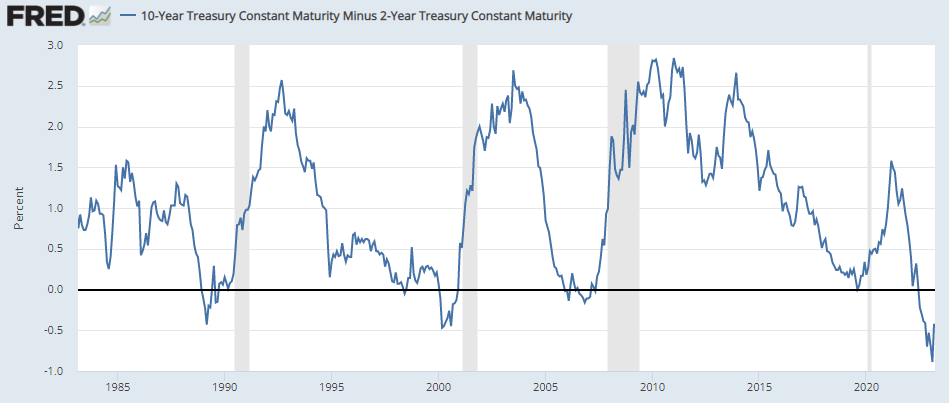
This yield curve is not one of my indicators for investment decisions; however, it is a good indicator of the economy. An inverted yield curve signals that a recession is coming, and right now, yes, it is inverted.
Many experts like to dismiss the yield curve signal by stating that it has predicted 9 of the last 6 recessions, which implies many false alarms. I would argue that it has always been correct, but it is always early—very early. Recessions come when the bond market realizes they are coming, and it fixes this inversion of yields.
When you look at the chart, you will see times when the blue line drops below zero. That is the inverted curve. Then comes what looks like a return to the positive side, followed every time by a grey bar. These are recessions.
Where Are We Headed?
The benefit of constructing scenarios is to remove fear (and fear of missing out) from the decision. Instead, we should ask, “How much risk are we willing to accept at the moment?”
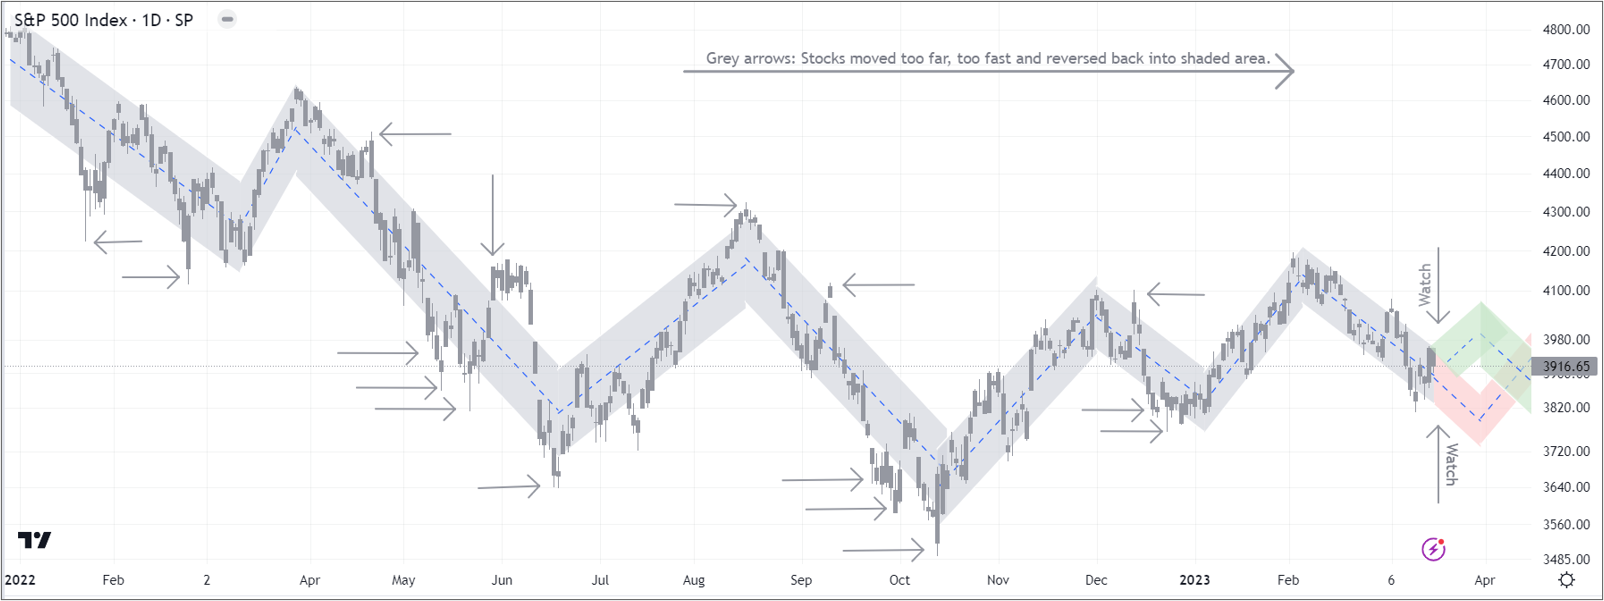
I don’t see any reason to take a lot of risk right now. Stocks have not had a major drop since last September. Instead, every selloff has been followed by a good bounce, and every bounce has been followed by a selloff. I suspect this will change in the summer. Until then, the green and red paths will end up in approximately the same area.
I modified my chart to show what markets did during each day rather than just the closing value. I also tightened up the shaded trends and added arrows to mark times when the market moved beyond its limits. This exercise is to draw attention to turning points, as I believe we could see one in the next week or two.
There is often a change in the short trend when the market moves too far, too fast. Sometimes these last for a few days before moving back into the trend. Sometimes they start a whole new trend.
I suspect there is a good chance that this market moves to one extreme or another this week. It may fake out investors by moving down (up) and then reversing into the green (red) path. If we move beyond the shaded area in either direction, then I will be watching for a reverse on Wednesday when the Fed meets. Of course, anything could happen: red, green, or something totally different. If I were to draw a third likely scenario, I would place it just between the two others. We will see.