
Making good decisions and sticking with them for a long time is a recipe for investment success. Short-term indicators discussed in this email may create an illusion that timing the market is simple. It is not. Anything can happen in the stock market.
What Happened?
Inflation news continues to be a major driver in markets. Last week, the government announced a rebalance in calculations to better match how Americans spend their money. The result was an increase in prices—even greater than previously reported.
Who is really surprised to find out that prices increased in December? We feel it when we go out to eat and shop for groceries. We see it at the gas pump, where we have been paying higher prices recently. Even used car prices ticked up again. Here is a graph of inflation changes.
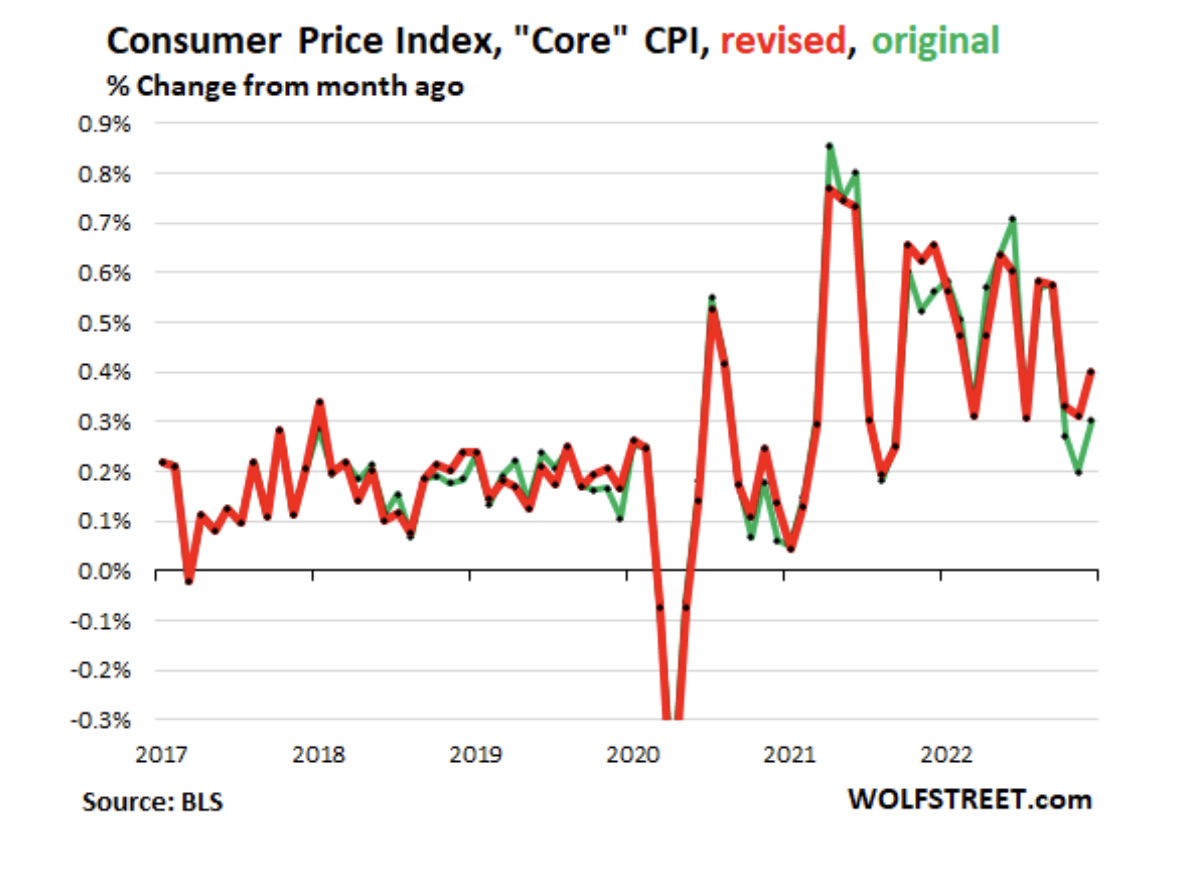
The red line (new calculation) is not significantly different from the green (old calculation). It does not change the slowing trend. It does remove proof that inflation is no longer a concern. If the next inflation number shows another move up in the red line, then I see even more reason for concern. It would bring into question the possibility of interest rates coming down any time soon, which would spell trouble for interest-rate-sensitive sectors like housing.
Education: Reversion to the Mean and Housing
Home construction, furnishings, appliances, and other housing services have a major impact on the U.S. economy. In total, all of this represents almost 20% of all GDP. It’s a big deal, and it is extremely sensitive to changes in interest rates.
Home prices are determined by affordability and the balance between supply and demand. Supply is tight, and it has been since 2012. This has helped push prices up. They are now holding near all-time highs. What about affordability? As rates have increased, affordability has never been worse. Unless mortgage rates come down, it is hard to imagine prices staying this high.
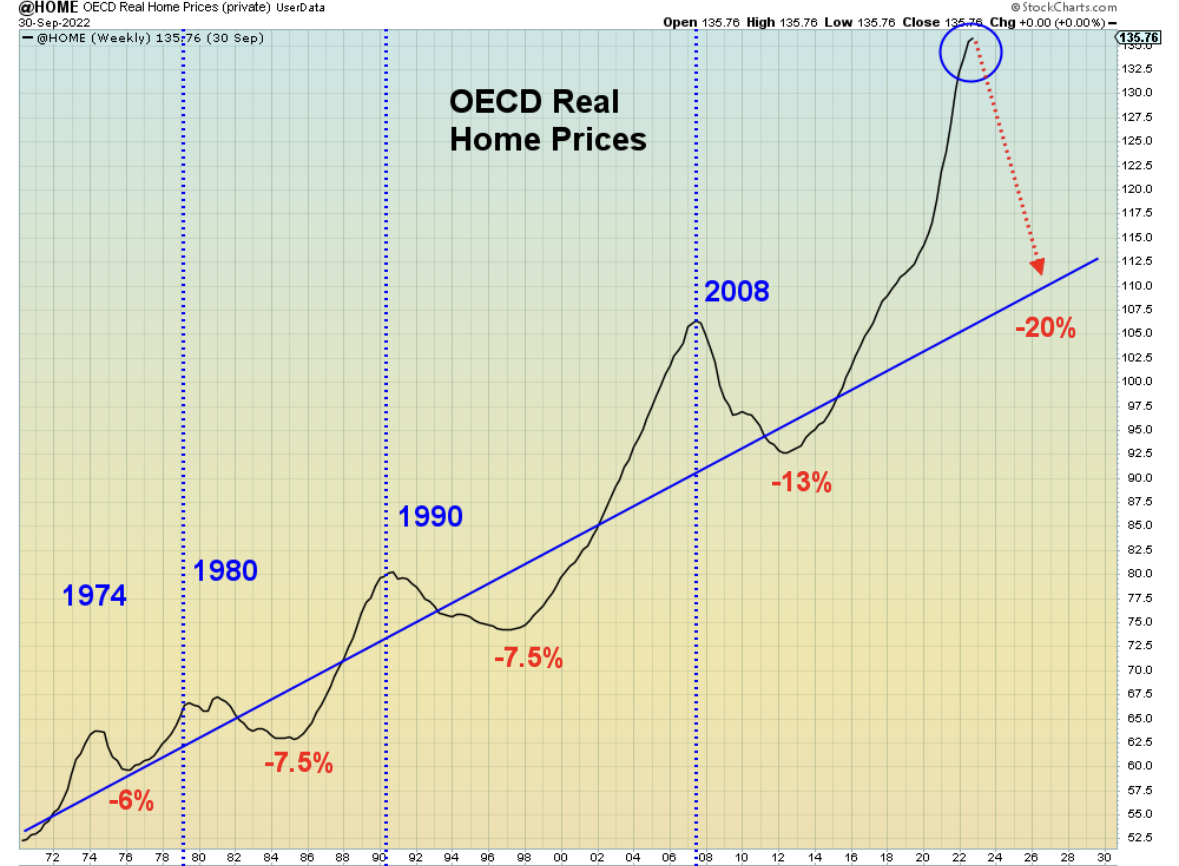
In statistics, we have a phenomenon called reversion to the mean—a return to average. In the graph below, we can see that it has occurred many times in history for the housing market. The graph also points to a potential drop back to normal.
I am aware of three homes for sale within two blocks of my home. They have all been on the market for about 6 months. Up to this point, I do not believe the asking prices have come down. Something similar is likely going on all over the country. What would it take to push prices toward that long-term average? Sellers would have to become much more desperate.
I am continuing to watch for clues in employment, which is looking just fine for now. However, I will continue to believe the housing market is vulnerable as long as mortgage rates are above their 20-year average. Perhaps, employment changes in the housing industry will be the tipping point.
Where Are We Headed?
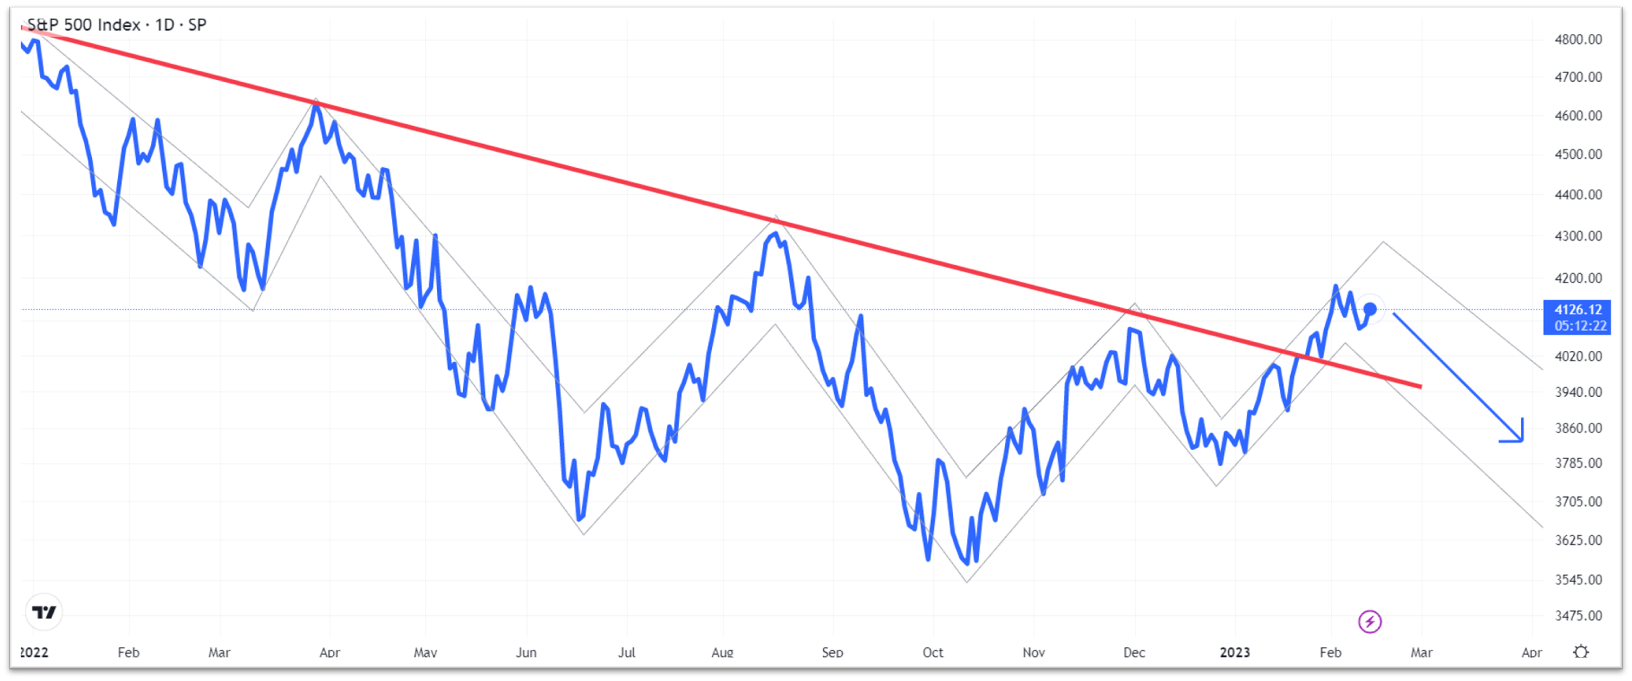
My outlook has not changed. Momentum in the stock market is positive, but corporate earnings are falling, and valuations are far from attractive. The 4,125 level in the S&P 500 index has been like a magnet. That probably won’t last much longer, especially with inflation numbers getting released on Valentine’s Day. To the upside, I see a potential target of 4,270, which would be an increase of about 3.5%. On the downside, I see potential for much worse than just a 3.5% drop. Of course, anything could happen. Only time will tell how far we go and in which direction.