

Making good decisions and sticking with them for a long time is a recipe for investment success. Short-term indicators discussed in this email may create an illusion that timing the market is simple. It is not. Anything can happen in the stock market.
Inflation is down. Bonds, stocks, and commodities are up.
The stock market moved up and down in waves during 2022—each lasting 1 to 3 months. The upward movements were often stopped by unsustainable optimism and an invisible resistance line. Just two weeks into the new year, we have reached that point again.
Many contrarian investors claim that markets must go higher because of the overwhelming pessimism. While I do love the idea of going against the crowd, I do not believe the data support any scenario where the market “must” do anything from here because there are just as many signs of irrational exuberance as there are persistent gloom. Here is my list:
Signs that markets may be headed higher:
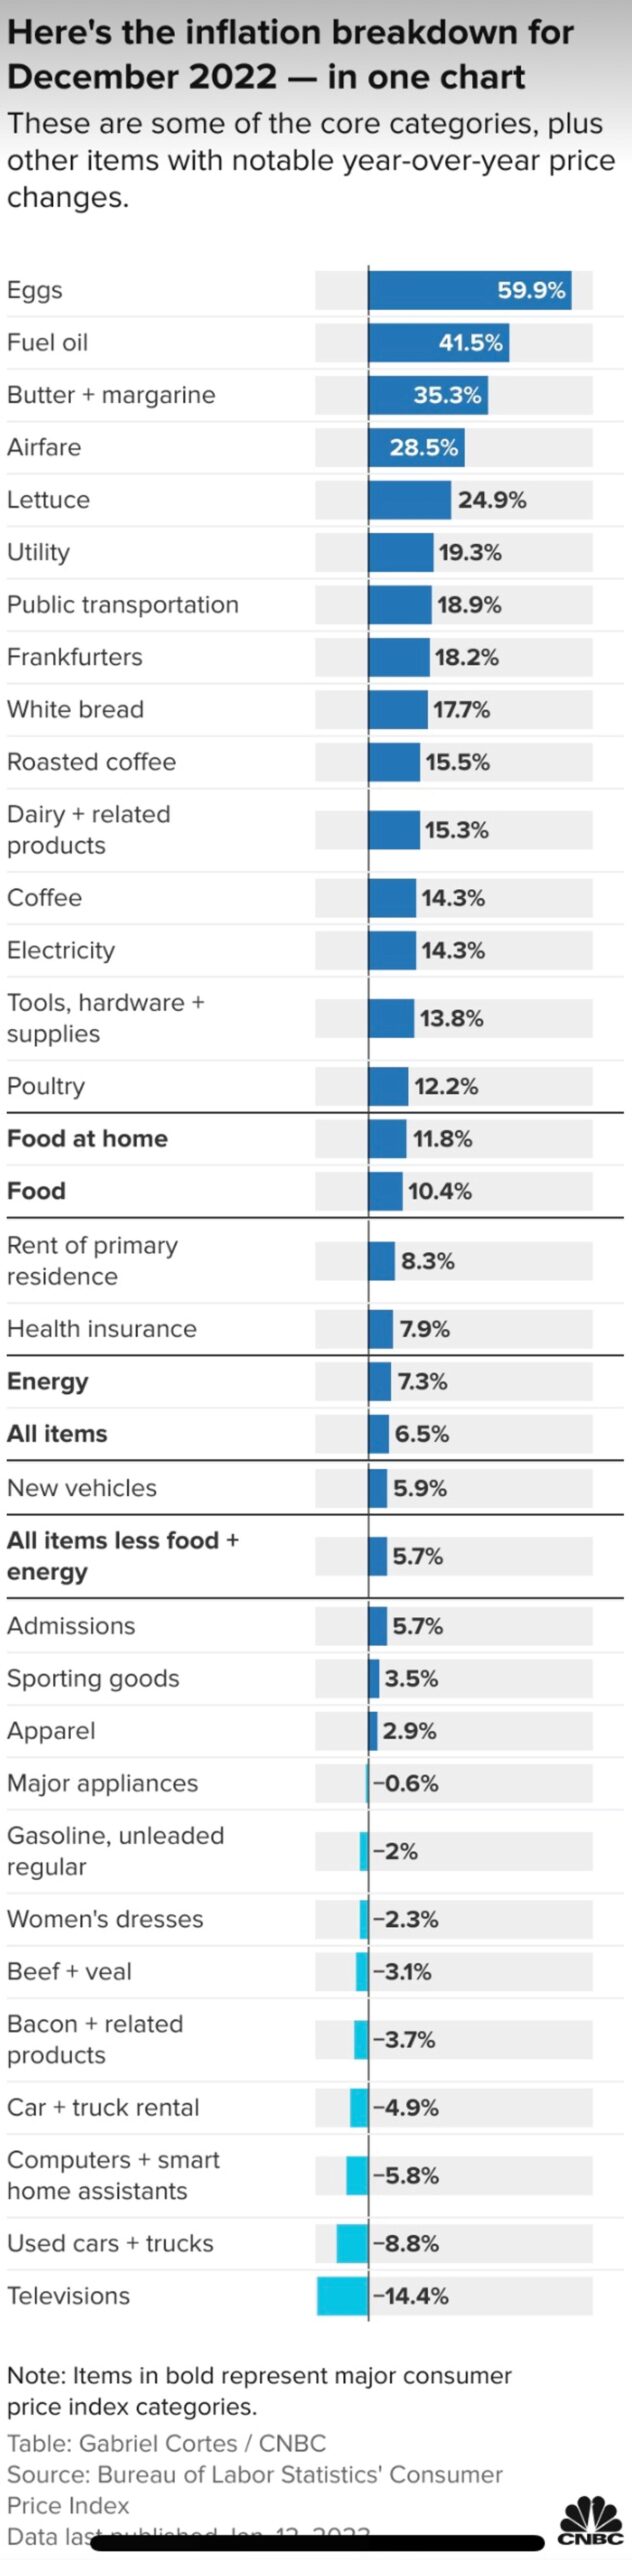
- U.S. Inflation has fallen to 6.5%.
- The market expects the Fed to start lower interest rates this year.
- The unemployment rate is a historically low 3.5%.
- Bonds, stocks, and commodities signaled immense positive momentum.
- Speculative assets are climbing like it’s 2020.
- Japan and China are stimulating their economies with more money.
- American borrowing and spending are increasing.
Signs that markets may be headed lower:
- U.S. inflation is way above the target of 2%.
- The Fed has no plans to lower rates in 2023. It wants them higher for longer.
- High mortgage rates have halted home sales, and a glut of construction is still ongoing.
- Momentum in stocks may be too positive to be sustained.
- Speculative assets are rising like it’s 2020.
- The volatility index (VIX) is as low as it was when the bear market began in January 2022.
Educational Section
Inflation is coming down, and the economy is still growing. This Goldilocks scenario is not too hot or too cold. However, risks remain. (1) The impact of higher interest rates may continue to slow the economy. (2) Consumer demand may be too positive for inflation to reach 2%.
In the 1970s, the U.S. Federal Reserve (Fed) thought it had conquered inflation when it brought it down from 11% to 6%. It was wrong as inflation came back and went all the way to 13.5%. The Fed does not want to declare victory in 2023 as inflation reaches 6.5%. That is still more than three times the goal of 2%.
The Fed is draining just under $100 billion from the economy each month. This is known as quantitative tightening, which is the opposite of what the Fed did from 2008 to 2021. This idea of almost unlimited support for financial markets was, in part, replicating what the Bank of Japan (BOJ) has been doing in its country since the early 1990s.
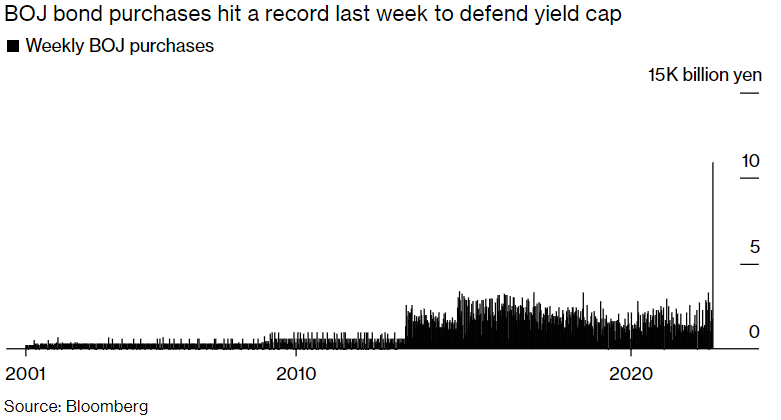
Japan has the third largest economy in the world, and the BOJ has been doing the exact opposite as the Fed. The BOJ has been stimulating its economy with a massive amount of new money since October 2022. It is like what the Fed did in 2020. In the last week alone, the BOJ added $81 billion to markets to keep its economy going up. This blows away previous records (see graph). It is more than the U.S. Fed is pulling from the financial system and is also unsustainable. I am not sure if there is another country on Earth that could pull this off without severe financial consequences. For Japan, it is business as usual.
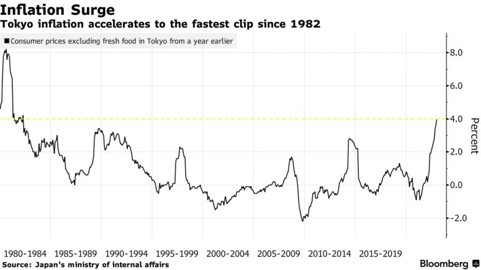
For the first time in decades, Japanese inflation has reached 4%—the highest level since the early 1980s. Last weekend, we learned that Japan’s Producer Price Index is 10.2%. This week, the BOJ may try to decide to announce an end to all the printing of money.
Where are we headed?
U.S. markets are at a crossroads. Bulls see upward momentum strong enough to signal higher prices over the coming weeks. Bears point to an overbought market that is likely to come down soon. According to my indicators, both are correct. As I always say, anything could happen. One thing is sure; this is a high-risk market.
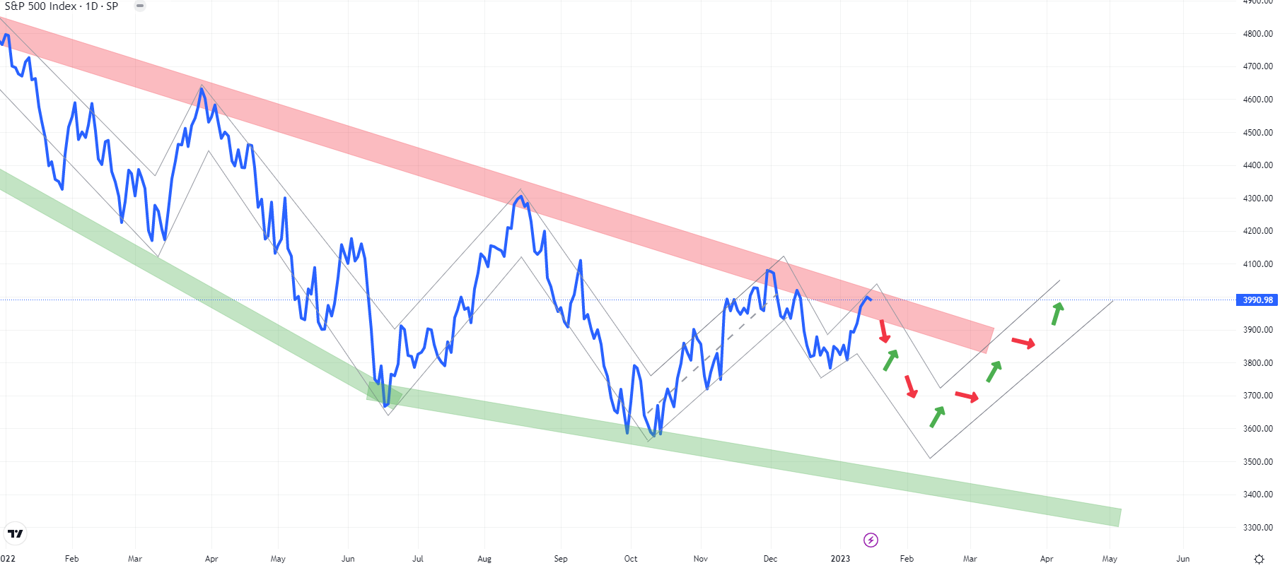
My graph for markets over the coming months has changed as the downward channel I had drawn was broken. This happens all the time. Sometimes it moves back, but it often just moves in another direction. The goal is to make an educated guess on the most likely paths in the future. So, what are those paths now? I see two possible scenarios going forward. Both end up in the same place near the end of February.
The green path moves higher, keeping the market overbought until the Fed meeting on February 1st. I would suspect that if stocks move up that entire time, then bonds and commodities would as well. This would be contrary to what the Fed is trying to accomplish and would certainly raise the probability of inflation staying high. The Fed Chair, Jerome Powell, would likely express deep concern over inflation coming back up and say whatever needs to be said that day to bring down enthusiasm.
The Red path has the market headed lower in the next week. The reason could be disappointing corporate earnings, the BOJ, or something else.
Always remember, anything can happen: red path, green path, or something completely different. Either way, the market is not going to move in a straight line. Volatility is likely to continue daily, weekly, and month to month—making things difficult for investors.
This newsletter is for educational purposes. The opinions may or may not come to pass. Timing the market successfully is extremely difficult. All investing involves risk, including possible loss of principal. The S&P 500 is used here to represent the U.S. stock market. One cannot invest directly in an index. Diversification does not guarantee positive outcomes. This is not a solicitation to buy or sell any security.