
If your answer is yes, you are not alone. We are emotional creatures. When things get rocky, or we perceive they are rocky, we can make decisions that feel good at the time, but in the long run, are not in our best interest. Let me share an example you may relate too.
You have worked hard and saved diligently for years, and finally, you have reached your financial goal, be it: saving for retirement, building a nest egg for a future purchase, or another purpose altogether. You feel a sense of relief – I did it! Once you reach this target number, every emotion you have regarding the market going forward may be tied to that target number.
How do you feel when you see that number going down? For some, the feeling is panic! All we can think is, “It took me forever to get to this point and I cannot afford to lose anything.” This is an emotional response. You have abandoned future perspective and are focusing only on the here and now. We often see this response to market volatility when someone is getting close to retiring or has retired. Suddenly, our long-term perspective is tomorrow afternoon. We have completely discounted the value of market performance over time.
I realize you may not enjoy looking at charts but bear with me for just a minute. Look at the two charts below. How do you feel about the chart on the left? How do you feel about the chart on the right? Believe it or not, the chart on the left is merely a subsection, representing a 90-day period, from the chart on the right, which illustrates a 5-year period. The difference is when viewing volatility over a longer time period it feels more comfortable than it does when viewed in a short period of time.
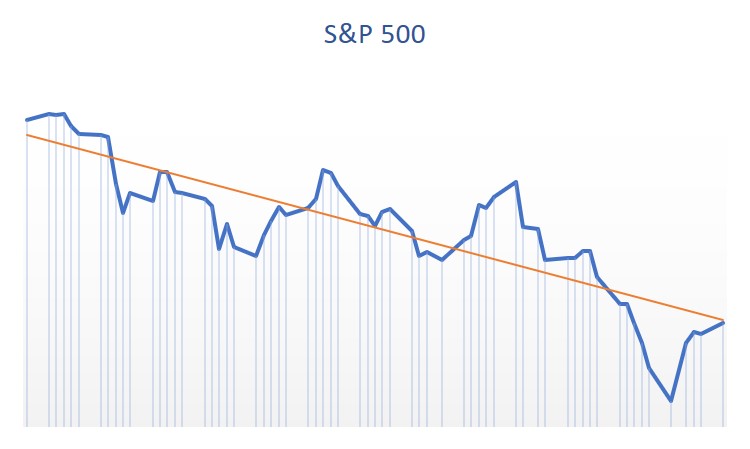
90 Days 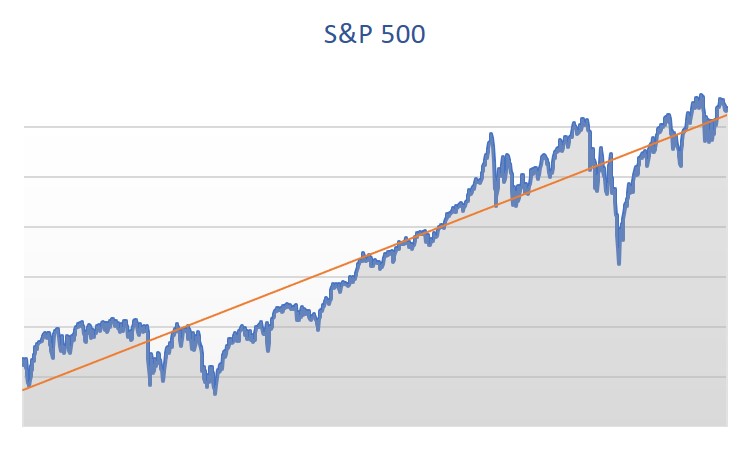
5-Years
It is so easy to adopt a myopic view when emotionally, we feel like we should flee to safety. What the two charts teach us is that volatility is subjective and can be controlled by how often we look at our account balance. Now, look at the next two charts showing the exact 5-year period. The chart of the left represents the market value at the end of each quarter. The chart the right represents the market value each day. My guess is you feel better about the smoother chart to the left.
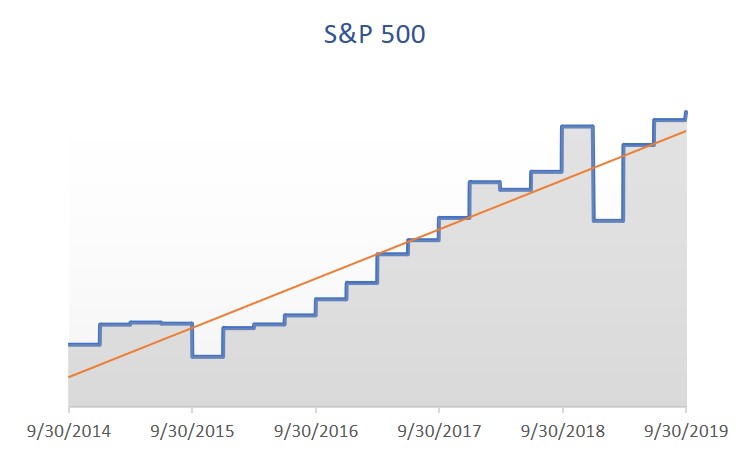
5-Years 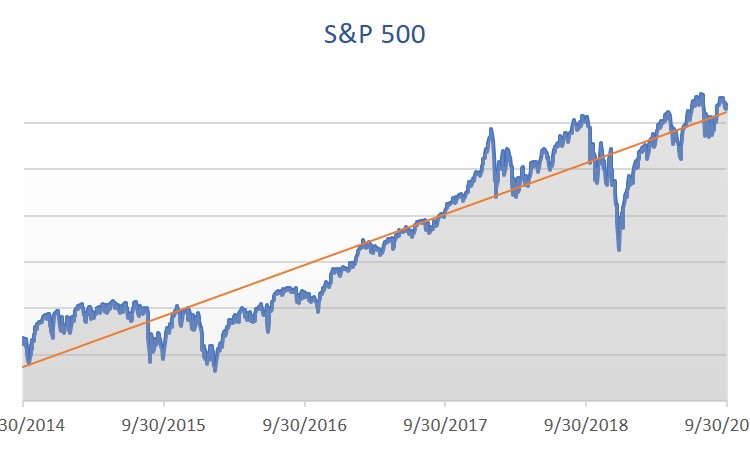
5-Years
Managing your emotions during times of increased market volatility is challenging but can be done. Here are a few tips to help you through the volatile times.
1) Try to review your account no more than quarterly.
2) When you hear concerning news in the media remember; their job is to sell headlines and stories not to give personalized investment advice to you.
3) If you are feeling concerned, reach out to us. That is why we are here.
We have information regarding your financial situation, your financial plan, your investments, and the markets. We will give you advice and perspective that will help you stay on track.
*The illustrations are for educational purposes and are not indicative of an actual investment return. The Standard and Poor’s 500 (S&P 500) index is often considered to represent the U.S. stock market. Investments cannot be made directly into an index. Historical performance does not guarantee future results.